
Smart Money Concepts (SMC) provides one way to describe price structure and common chart patterns. The vocabulary is useful for analysis, but these interpretations are not direct proof of institutional intentions or guaranteed market forecasts.
What is a liquidity sweep?
In SMC-style chart analysis, a liquidity sweep describes price temporarily trading beyond a visible level such as a prior high or low, sometimes followed by a reversal. The observable fact is that price moved through the level. Whether stop-loss orders caused the move, or whether an institution intentionally engineered it, usually cannot be confirmed from a retail price chart alone.
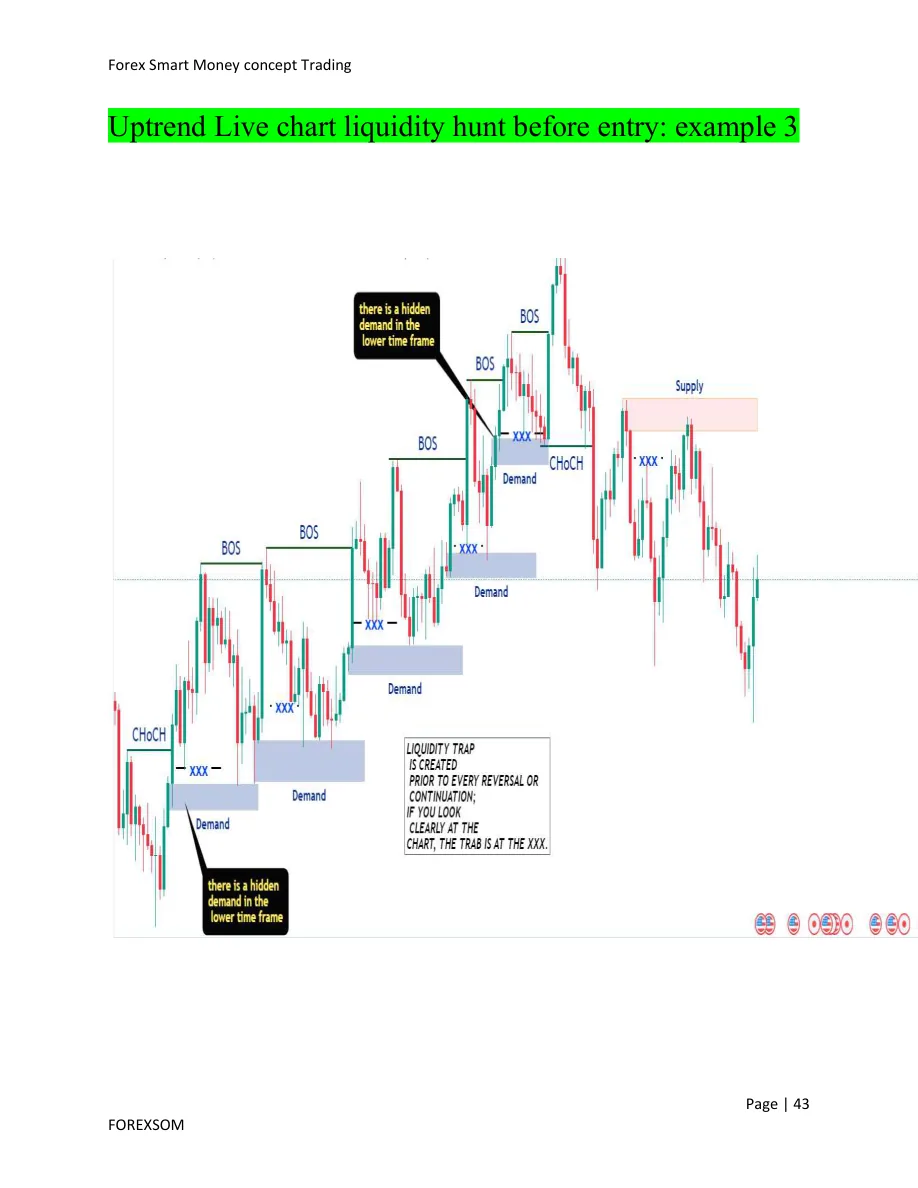
Why obvious highs and lows receive attention
Prior highs, prior lows and repeated levels can attract attention because traders may place entries, exits and stops near them. However, actual order placement in the decentralized spot Forex market is not fully observable through a typical candlestick chart.
Sweep versus breakout
A break of a prior level can reverse, continue, or consolidate. Do not define a reversal simply because price wicked through a high or low. Traders can compare the follow-through, structural context, time of day, news and predefined entry conditions, while recognizing none guarantees an outcome.
How to use this in a study plan
Mark the liquidity level before price reaches it. Note what happens afterward without hindsight. Compare several examples, including those that continued rather than reversed. Include failed cases in a journal; otherwise the pattern may appear more reliable than it is.
Make the analysis practical
Use the free five-condition checklist to record direction, location, liquidity, confirmation and risk before considering a trading decision. If a required condition is missing, stand aside.
Open Free Checklist →